What did he do?
He was
the first investigator who carried out research designed to test whether
astrology is true according to good scientific standards, being a professional
statistician.
First
of all, he tested well defined samples of people (e.g. the Biographical Index
of members of the Academy of Medicine, 1939) in order to exclude selection bias
and ensured that they were sufficiently large to achieve statistical
significance i.e. so that the probability that any findings would be very
unlikely to be due to chance.
Secondly,
he adjusted his findings for a number of confounding factors e.g. that more
children are born at night than in the afternoon and that the time that a sign
of the zodiac is at the horizon in the East (which corresponds to an important
factor in astrology i.e. the rising sign or Ascendant differs according to the
sign.
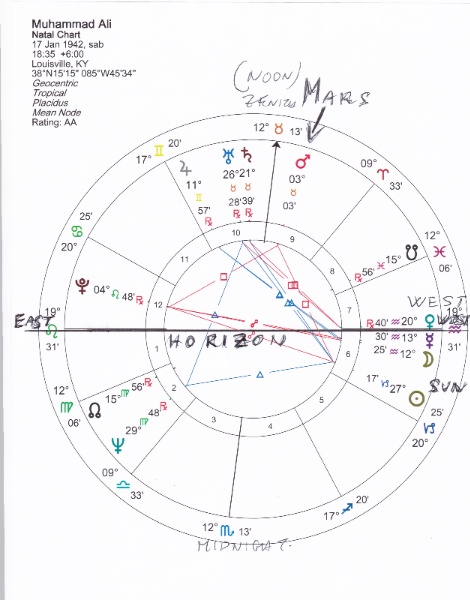
He
drew up the natal chart related to each birth duly noting the positions
of the sun signs, the houses and the planets on a circle with a horizontal
axis representing the horizon: the top half of the circle represents the
sky during the day, the bottom half the sky during the night, with the left
extremity of the horizontal axis corresponding to the East where the sun rises
and the right extremity corresponding to the West where the sun sets.
Below you can see an example of a natal chart, the one
of Muhammad Ali (Cassius Clay), a famous boxer.
You will notice that he was born at 06:35 PM, shortly after the sun had
set in the West.

Gauquelin
assessed differences in terms of all the main astrological factors that make up
a natal chart namely:
-
Signs of the zodiac
-
The Houses (according
to astrological tradition the sky is subdivided into 12 equal parts, starting
from the Ascendant which indicates house no 1; each house corresponds to a
domain of life, such as career, family, children, health, ect)
-
The Position of the
planets
-
The aspects i.e. the
relative position of one planet versus another
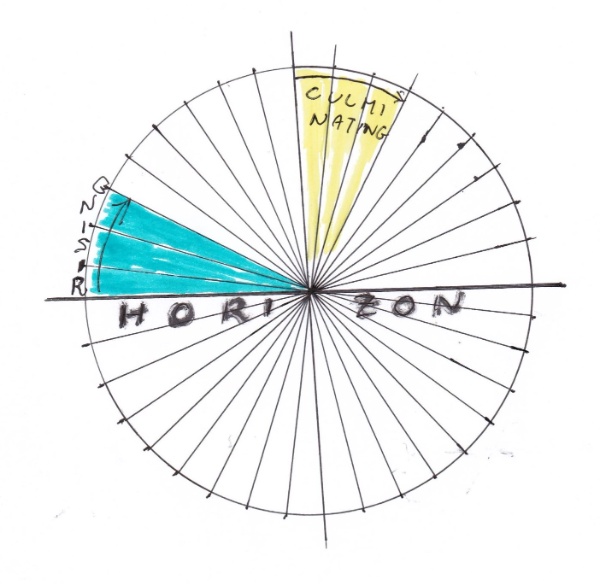
In order to assess potential differences in the
position of the planets he subdivided the circle into 36 equal sectors obtaining
a circle that resembled a roulette wheel.
He then allocated the position of the planets in each chart to one of
them. In this way he obtained
distribution frequencies related to each planet and could see whether the
distributions throughout the circle were homogenous or not. In the event of deviations, he calculated the
probability that they were due to chance alone.
His
“roulette wheel” is shown below.

At
first he assessed the charts only of Frenchmen.
This was feasible since at that time anyone could has for the birth
certificate of anyone else and the French certificate included the birth time.
After
his first findings related to profession were published one of the main
criticisms was that his data was related only to French births. He therefore decided to collect cases from
other countries as well. Unfortunately,
he discovered that birthtimes in America were unreliable, that birth
certificates do not provide birth time (UK, Ireland), that there were no birth
registries (Scandinavia) or that the authorities were not willing to provide
access (Eastern Europe and Spain). That
left few countries for his investigations, which in the end included 27,000
birth records: 12,000 from France,
7,000 from Italy, 3,000 from Germany, 3,000 from Belgium and 2,000 from
Holland. The selection was always
related to well defined groups of professionals, such as the Index mentioned
earlier.